Metrics
Overview
Metrics control how progress and data are visualized on each Work Item. From built-in progress tracking (counts and percentages) to fully customizable fields, Metrics help teams quickly quickly understand progress and make informed decisions at a glance.
Progress Metrics
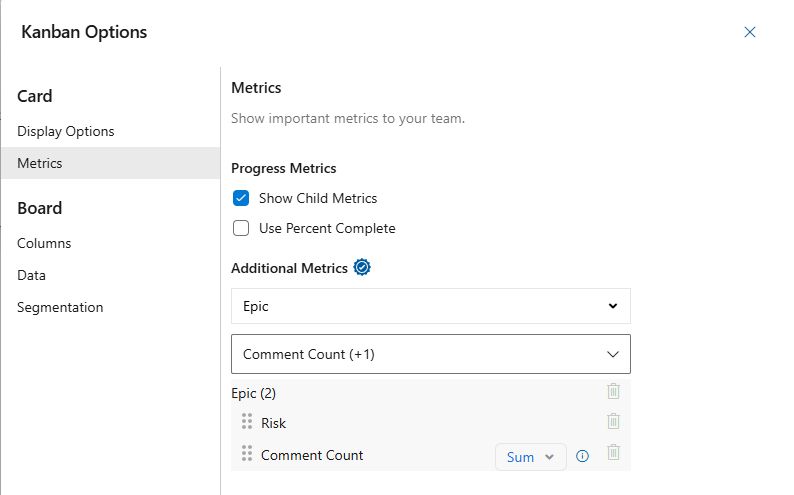
Control how progress is displayed for child Work Items on each parent card. Metrics can be shown as raw counts or as percentages.
- Show Child Metrics: Displays an icon for each type of child Work Item along with the count of completed items.
- Use Percent Complete: Converts the above metrics into percentages instead of counts.
Additional Metrics (Pro Feature)
User Selected Metrics allow you to display any Azure DevOps field on Roadmaps and Kanban views, including custom fields. This makes it easy to tailor views to track the data that matters most for planning and decision-making.
- Work Item Type (Top Dropdown): Select the Work Item Type (Epic, Feature, etc.) the metric applies to.
- Field (Bottom Dropdown): Select the field to display for the chosen Work Item Type.
Aggregates
Numeric fields (such as Comment Count) can be displayed directly or aggregated across child Work Items.
| Aggregate | Description |
|---|---|
| None | Displays the value from the Work Item only |
| Sum | Sums the value from the Work Item and all child Work Items |